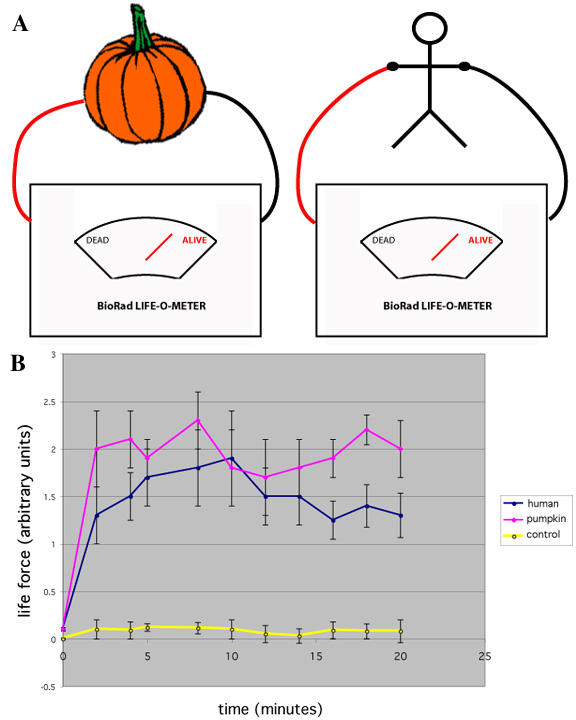
Figure 3. Detection of “Life
Force” within pumpkins.
A) Schematic diagram of Life Force Detection Apparatus
B) The amount of “Life force” over time of treated pumpkins
(pink) compared with living humans (blue) and a no-pumpkin control (yellow).
Mean ± SEM, p<0.000000000001.